
Buyers Credit transactions are funded on Libor rates. Thus any change in Libor directly impact overall costing of the transaction.
Libor rates started rising in 2015 and pace of which got picked up since beginning of 2017. Below 3 Month Libor and 6 Month Libor charts shows the trend. There are two charts for two range.
- First shows last 6 years trend
- Second shows trend since 1990.
3 Month Libor Trends
Source: www.macrotrends.net
- Lowest rate in Last 10 Years was on 28 Apr 2015: 0.22%
- Highest rate in Last 10 Years was on 10 Sep 2007: 5.65%
- Latest rate: 09 Feb 2018: 1.79989%
6 Month Libor Trends
Source: www.macrotrends.net
- Lowest rate in last 10 years was on 13 Oct 2015: 0.32 %
- Highest rate in last 10 years was on 03 Jul 2006 : 5.63%
- Latest rate on 09 Feb 2018: 2.00438%
Reason for Increase in Libor Rates
US Federal Reserve Bank started increasing rate of interest in US beginning 2016 because of which USD Libor rates started going up.
US Fed is expected to further increase the rates and below chart shows forecast of rates over the years. It is expected to reach 3% by 2018 from 0.25% at the beginning of 2016.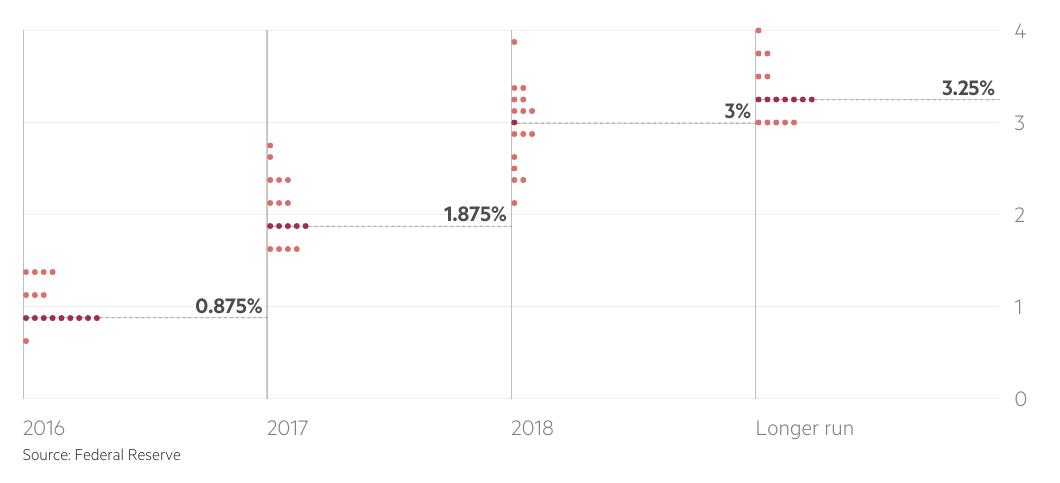
Source: Financial Times
Impact on Buyers Credit and Indian Importers
- Between 2015 and 2018, assuming margin (Libor + Margin) remaining same, overall costing of buyers credit has gone up by 1.60% as Libor for respective tenure has gone up.
- Forward premium during this period have come down from 8.5% to about 4.5%.
What Should an Importer Do ?
- Continuous evaluate Libor rates for funding tenure and overall costing of Buyers Credit.
- Lock long term buyers credit transaction (Capital Goods import) with 12 Month Libor reset instead of 6 Month Reset.
- If workable, look at EUR or JPY currency for underlying import transaction instead of USD. Libor for both these currency are currently in Negative or in Zero territory. Before doing the same one need to consider currency risk coming along with it.
- Comparing overall Libor based funding cost with Indian Financing Rates.
